Place Labels in Cesium using Vector Data Tiles

By Dmitry Kiselev
February 13, 2025
Cesium is like an IKEA globe: it can do almost anything, but you have to put it together yourself. One major missing feature is labels for cities. Compare the default views of Google Earth and Cesium, and you’ll notice this immediately.
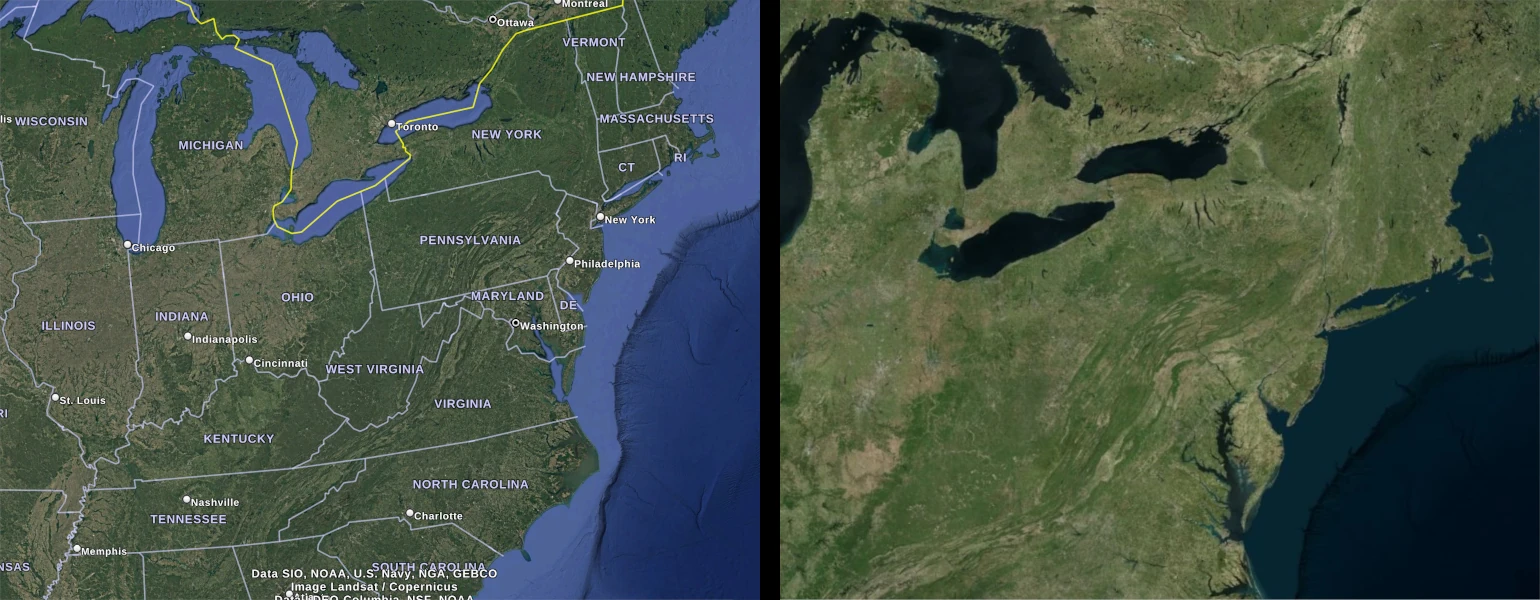
Left: Google Earth default view, with labels and state lines. Right: Cesium default view, with no labels or markers.
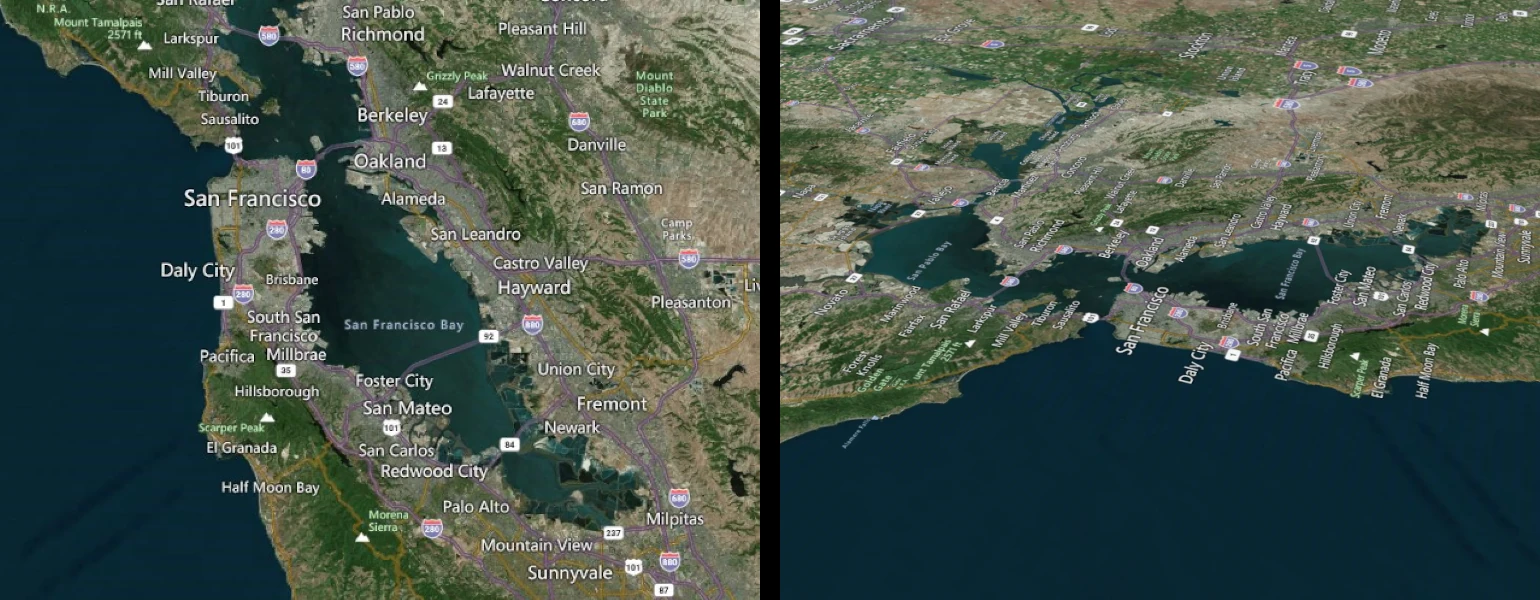
If you’re reading this post, you might be able to find any major U.S. city without any clues, but most people can’t. You can overlay imagery that includes labels as part of the image, but this approach has a significant drawback: as soon as you rotate the view away from north-up, the labels become difficult to read.
In Google Earth, this issue is handled using vector data overlays. Labels, borders, and other similar elements are examples of how useful vector overlays can be.
Cesium also supports vector features such as labels, polylines, and polygons. You can create them manually or use CZML or KML to add such features to a scene. If you use KML, Cesium translates it internally, but the result is the same. Vector features have distinct advantages for 3D geographic data, with labels being the most obvious example.
Challenges of Vector Data in Cesium
Displaying vector data in Cesium comes with some challenges. Since we cannot load and display all data at once, we have two options: keep it as vector data or rasterize it into imagery. Either way, we need to tile the data, breaking it into small chunks and generalizing or simplifying it.
Continuing with the example of labels: tiles covering large areas should include only essential labels (e.g., capital cities) to avoid excessive clutter. Similarly, for polylines such as roads or boundaries, we need to prioritize important roads and simplify their geometries.
Most GeoServers and data providers serve vector tiles encoded as GeoJSON, KML, or other binary formats. However, integrating them into Cesium or Google Earth requires additional steps.
There are two big considerations that need to be taken into account when integrating tiled vector data into any application:
- How particular geometric features (points, lines, and polygons) are encoded for every tile. Also, what are their attributes and how should they be represented and styled? This involves considering whether a point should have a label or an icon, what color should it be, etc.
- How the data is arranged. This includes how many levels it has, how you fetch new tiles, what the area each tile covers is, and how the software you are integrating with (in our case, Cesium) manages rendering, loading, and unloading the data.
In Google Earth, KML covers both issues in one technology. KML describes features and their styling, while for the arrangement of tiles you can use Network Link Regions. To put it simply, Network Link Regions define an area and as soon as the camera gets close enough to that area, Google Earth loads a new chunk of data for that area. You can read more about that in the KML docs.
In Cesium, this process is covered by multiple technologies, and not all of them work together. We have several encoding and styling options (CZML, KML, GeoJSON), but none of them natively support tiling.
On the other hand, Cesium 3D Tiles work well for large 3D meshes and point clouds, but they do not support CZML, KML, or GeoJSON as tile content.
To bridge this gap, Cesium provides the Vector Data tile format and 3D Tiles Styling.
Although they are still experimental, these features work with the standard Cesium distribution without any hacks or undocumented options.
Since I previously implemented city labels in Cesium, I decided to revisit the task to do it with this new standard in mind. In my earlier implementation, I had to rely on undocumented Cesium features to determine which tiles should be loaded and unloaded. More details about that approach can be found in my previous blog post.
Technical Implementation
For this tileset generation, I use two standards:
- Vector Data tile content with tileset styling
- Vector Data tile content defines how each tile is encoded
- Tileset styling determines how points, lines, and polygons are rendered
- Implicit tiling
- Implicit tiling defines tile arrangement and availability
Both standards use a mix of JSON and binary-encoded features. In a nutshell, to encode a point with a label you have to write a vctr file, a subtree file and a tileset.json file.
Each vctr file consists of the following sections:
- Header: Defines technical data, like the size of the sections in bytes and their offsets
- Feature Table: Defines how to read points, lines, or polygons from the binary data section In our case we just specify how many points we have
- Batch Table: Defines data specific attributes, in our case that will be a name for a point
- Binary data with positions and indices: Coordinates of the points optimized for storage size
Subtree files encode which child tiles are available, which of them have content, and what are the available subtrees.
tileset.json puts all that information together, defining what region the whole tileset covers, specifying that we are using implicit tiling, and defining URL templates for fetching vctr and subtree files.
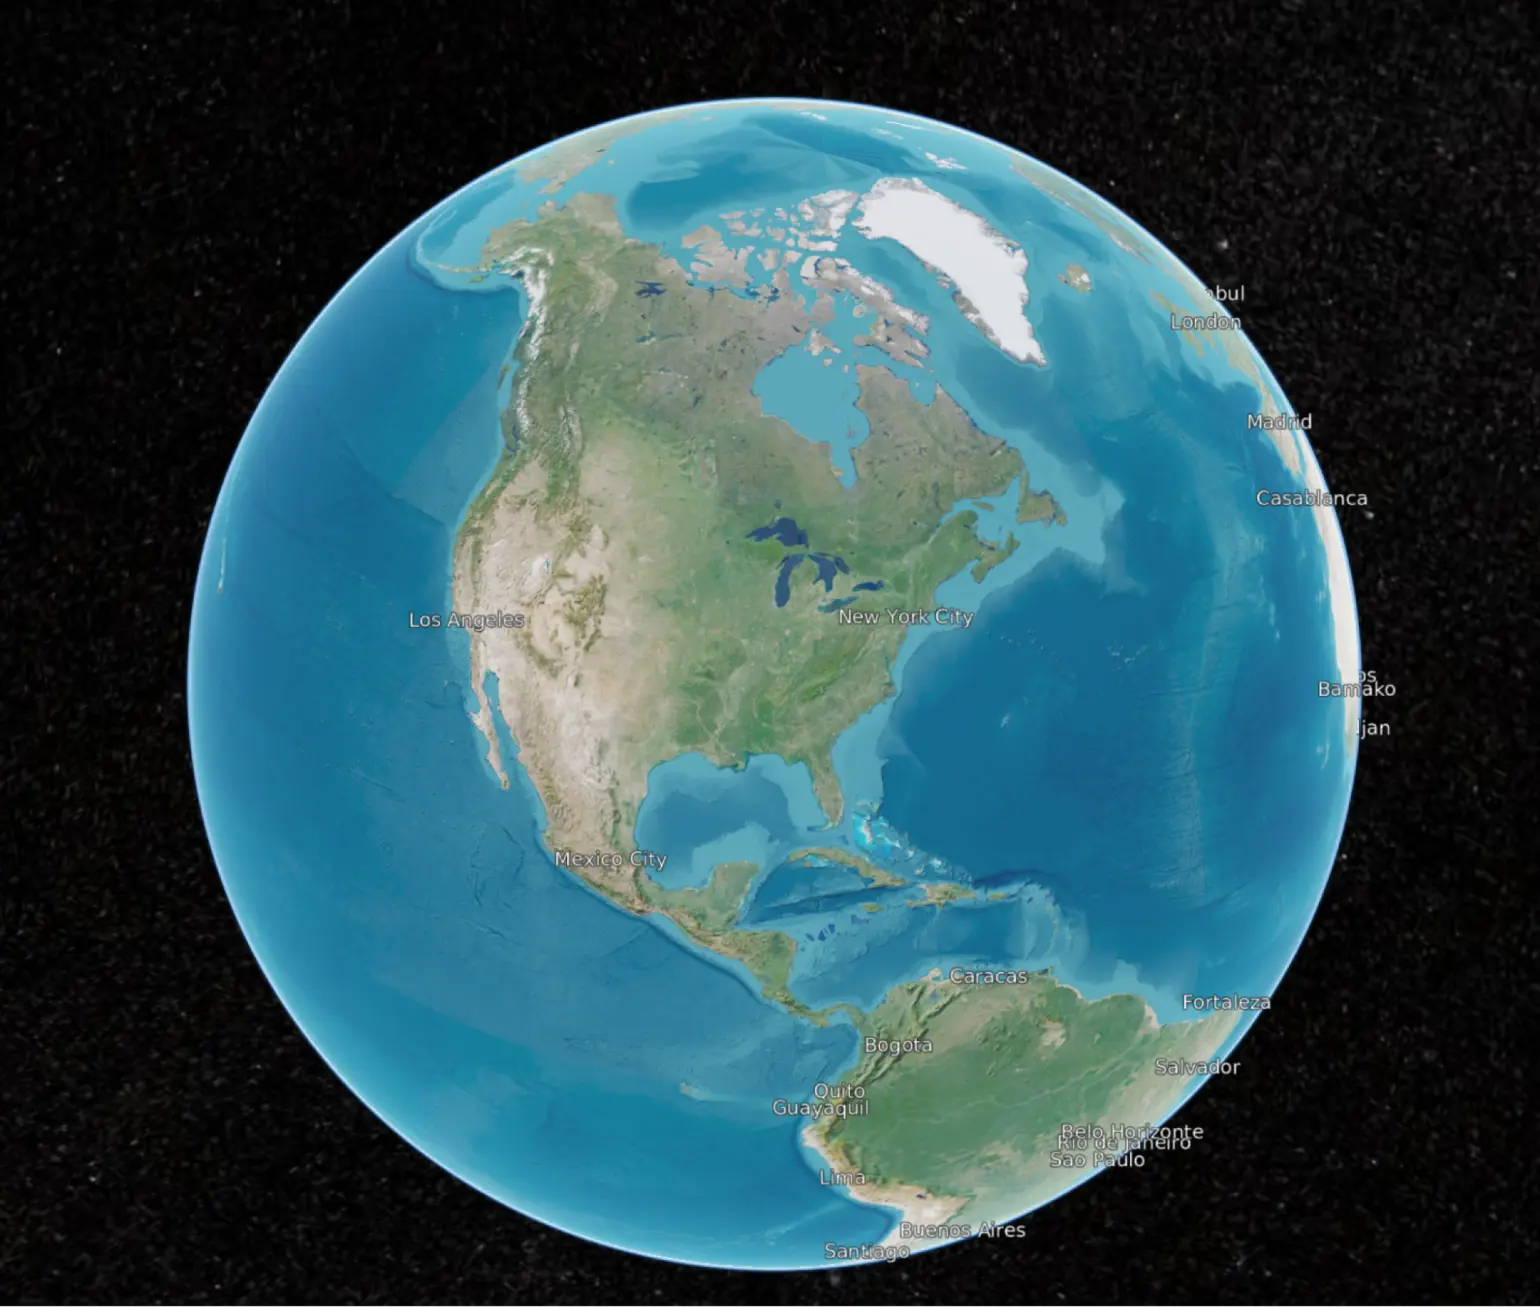
Add a style which tells Cesium that it should create a label for every point with its name attribute. And congratulations, we have our first set of labels!
Managing Uneven Label Distribution
But as soon as we zoom in we hit a problem: we have too many labels too close to each other.
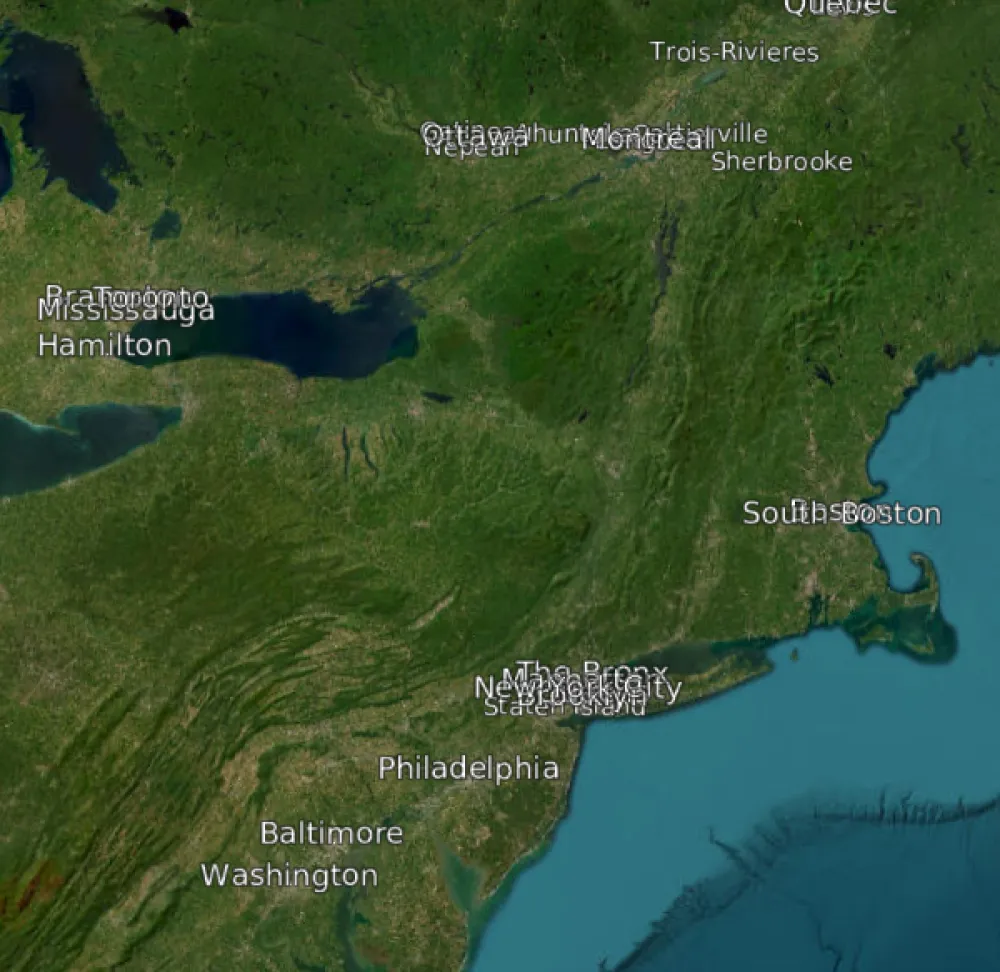
In order to avoid having the globe polluted with messy clumps of labels when zooming in, we have to discern how the visibility of 3D tile content is determined by Cesium. A key concept for handling this is assigning a geometricError value to each tile. The exact value might be complex to calculate, but the general rule is: the larger the geometricError, the bigger the distance from which a tile should be visible.
So as you zoom in closer, labels from tiles with bigger geometricError will appear sooner. Furthermore, for implicit tiling the geometricError of children tiles should be half of what their parent tiles’ geometricError values are. Practically speaking, this means that the geometricError value assigned to the root tile cascades throughout the system and changes how soon all of the labels become visible. To have some of the labels appear later than the others we have to push them down the tile tree.
The first thing I tried was to set a minimum tree depth for a label based on city size, but the end result was pretty much the same:
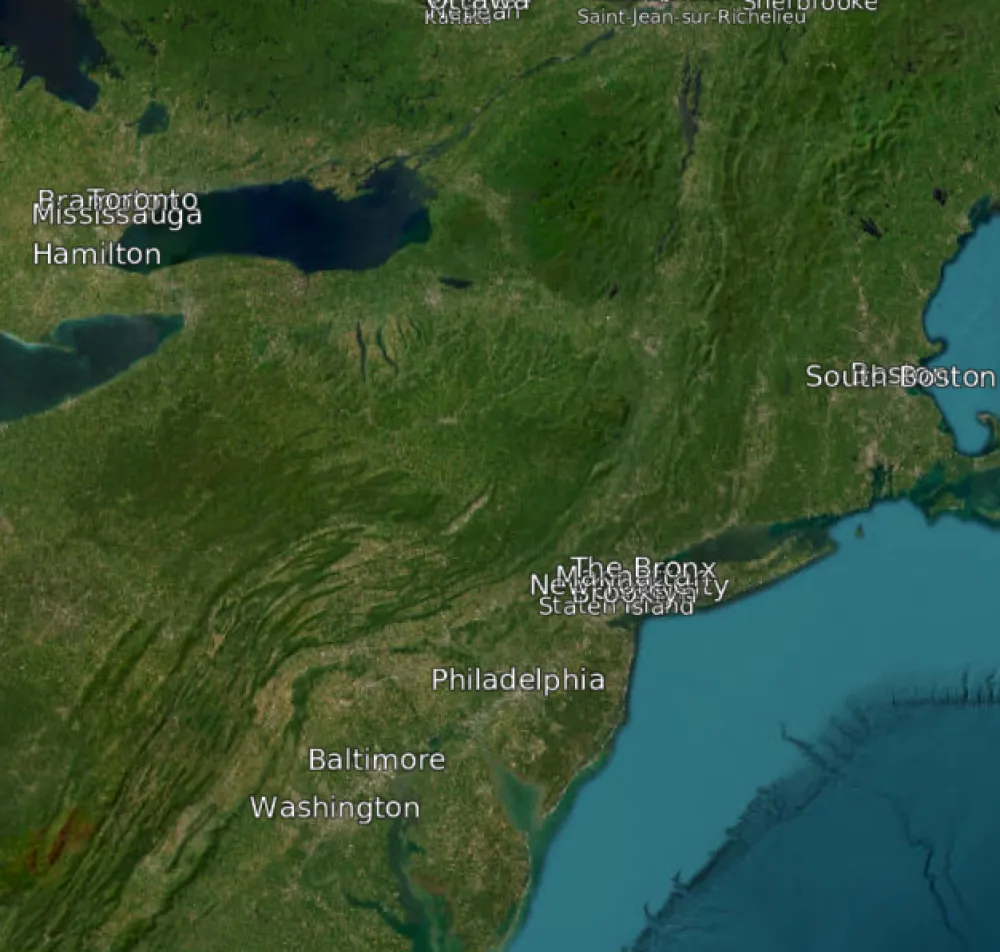
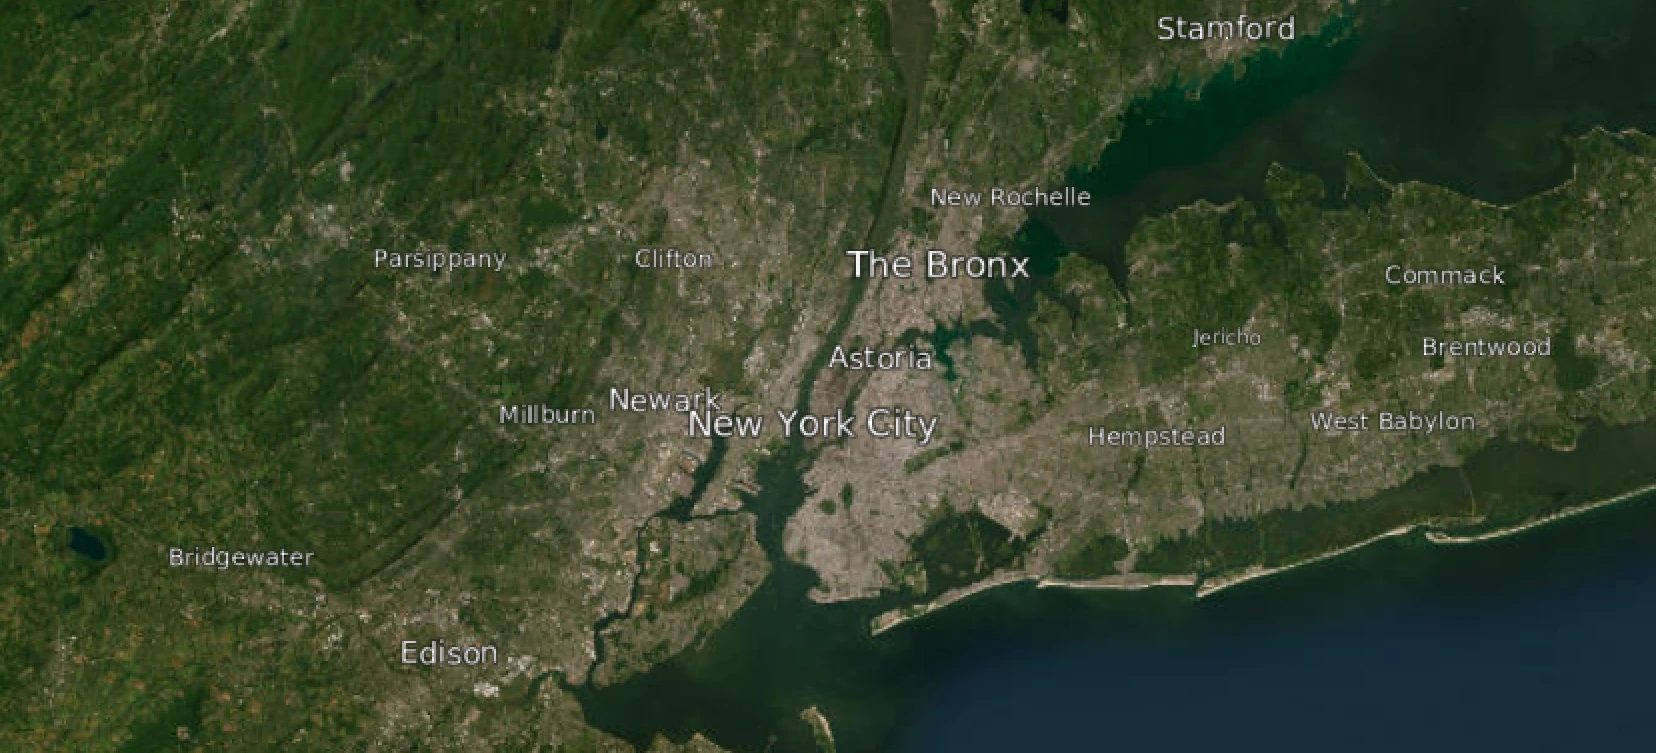
The root cause of the points clumping up is not small towns appearing too early, it’s how the populated places themself are distributed. “The Bronx” and “Manhattan” are just big and too close to each other and to “New York City”. If I try to push “Manhattan” deep enough so it doesn’t overlap with “New York City” based just on its size we won’t be able to see Boston or Baltimore or Hamilton, although they have plenty of space to be shown at this zoom level. Hence, we need a way to cluster points and determine point depth based on how much space there is between neighbours.
Clustering Labels
Clustering is a well-established problem in computational geometry, and there are plenty of libraries to solve it, but if I used one of them I would also have to integrate it with the tree structure of the tiles. So instead I’ve implemented a straightforward approach that is effective, although not 100% correct mathematically:
- For every level of the tree, calculate a distance threshold. The threshold gets smaller and smaller with every level of the tree. Let’s follow the same pattern as the tiles’
geometricErrorfor this threshold - For every point to be inserted into the tree, calculate the distance to a closest point in the tree
-
- If the distance is more than the threshold, just insert the point. If the distance is smaller than the threshold, let’s calculate how many levels we should skip to get the threshold small enough to insert the point at this level
- If an inserted point is more important than an existing point, then put the inserted point at the current level and push the old one down the tree instead
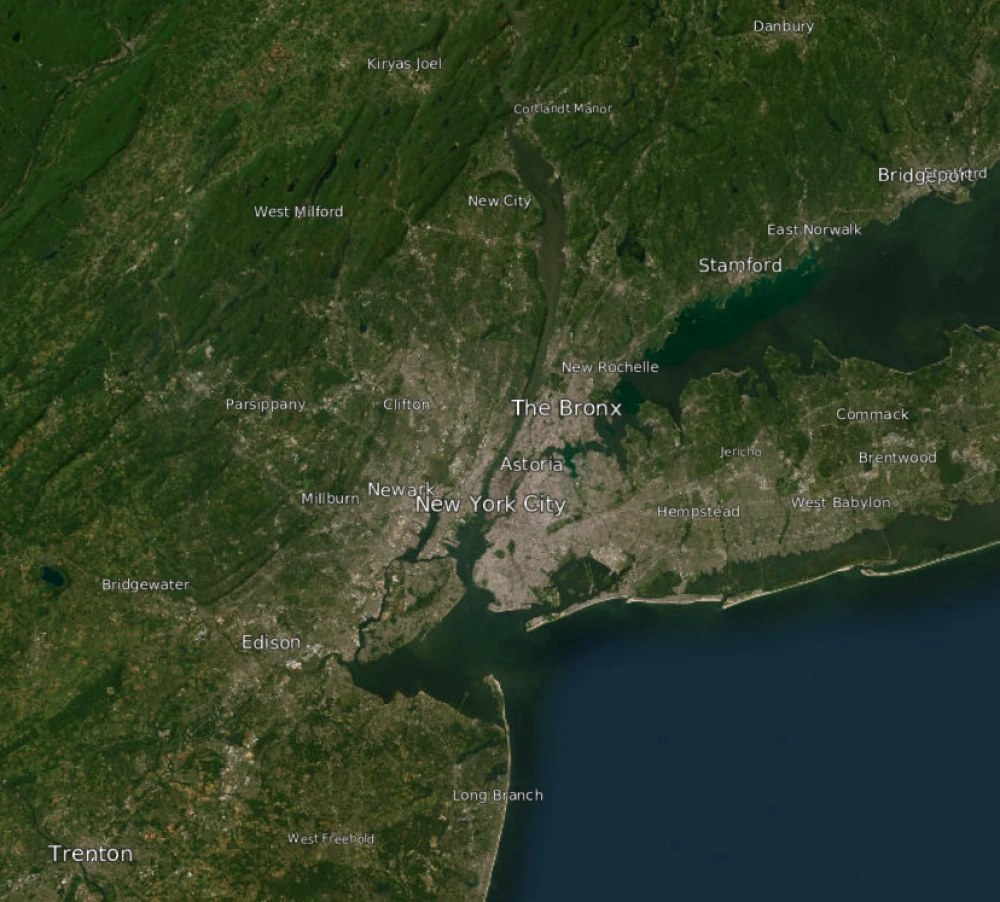
And so, there you have it:
Next Steps
Further steps I have in mind to expand on this work with vector tiles include:
- Enhancing styling options
- Encoding polylines
- Encoding polygons
Notes
The project is available on GitHub under the Apache-2.0 license: https://github.com/EndPointCorp/cesium-vector-data-tiles.
Place data is from GeoNames.org under the CC-BY license.
Screenshots use Bing Imagery, ArcGIS World Imagery, and Google Earth.
cesium gis visionport open-source
Comments